Mass Spec Terminology
Mass Spectrometry Terminology
m/z
This is the observed mass to charge ratio of an ion. To be observable in a mass spectrometer, molecules need to have a charge. The m/z is the mass of the molecule divided by the charge. In a lot of cases the charge is 1, so the mass and m/z are the same, but this is not always the case.
Precursor m/z
This is the m/z of an intact molecule before it is fragmented. To calculate this, you will need to calculate the monoisotopic mass of the molecule in the neutral form, then figure out which charged particle gives the molecule charge, something like H or Na. Then you will add the mass of this charged particle to mass of the neutral molecule. Then you will divide by the charge to get the precursor m/z of the molecule for that specific ionized form (adduct). This is generally notated as something like M+H or M+Na as examples. To calculate the precursor m/z for different adducts, use the calculator here
Scan
In mass spectrometry, a "scan" refers to the process of detecting ions across a range of mass-to-charge ratios (m/z). It is measuring the mass spectrum, which is a plot of the ion intensity as a function of the m/z. Each peak in the spectrum corresponds to a particular ion species.
This applies to both MS1 and tandem mass spectra.
Monoisotopic mass
The monoisotopic mass is the summed mass of a molecule. However, the mass values for each atom are not the average mass of the atom, but the mass of the most common isotope of that atom. This is because the most common isotope of an atom is the one that is most likely to be observed in nature and in our experiment. For example, the average mass of Carbon (C) is 12.011 Daltons but the mass of the most common isotope C12 is 12 Daltons. In mass spectrometry, it is more useful to use as a starting point the monoisotopic mass.
Mass Spectrometry Levels (e.g MS1 and MS2)
MS1 refers to the first level of mass spectrometry that surveys all intact molecules. Within one MS1 measurement (called a scan) we can see many ions representing many different compounds at the same time. When couple with liquid chromatography, we are able to see what ions are coming out of the column at that moment in time. Generally, MS1 are acquired repeated over time, something like 1 per second or more frequent to measure how the ions are changing over time.
Tandem mass spectrometry (MS/M2 or MS2) refers to a second measurement using the mass spectrometer of a specific molecule detected in the mass spectrometer. However, here we don't simply view it intact, but instead we isolate it and then break it apart. Then we measure the pieces of the molecule. This process, called fragmentation, is what allows us to get a fingerprint for the molecule. We can then utilize this MS/MS spectrum for identifcation purposes or other downstream analysis.
Extracted Ion Chromatograph (XIC/EIC)
The extraction ion chromatogram is looking at the same ion (typically in the MS1 spectrum) over time. This is a plot of the intensity of the ion over time.
You can see this as something that looks like this:
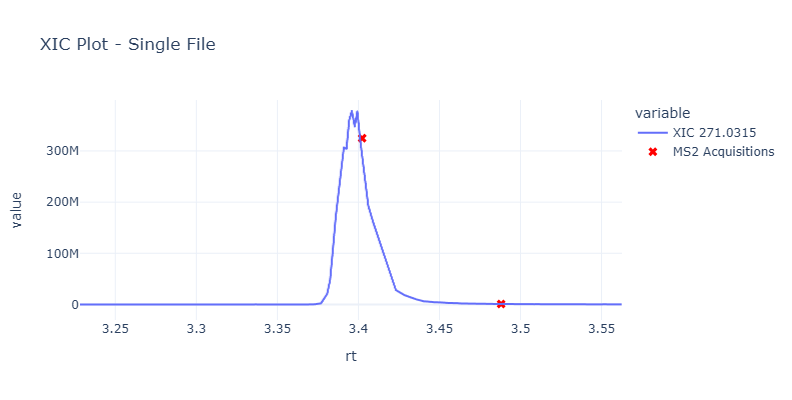
And here is the link to the interactive dashboard for this plot
Mass Spectrometry Data Frames
The standard data frame format for the lab is created via MassQL. Using MassQL, there will be two files that are generated:
- MS1 Data Feather/Parquet File with a suffix "_ms1.msql.feather"
- MS2 Data Feather/Parquet File with a suffix "_ms2.msql.feather"
MS1 Data Description
This file includes as each row all the MS1 peaks for the entire data file.
- i - This is the intensity of the peak
- i_norm - This is the relative intensity of an MS1 peak within its spectrum. The largest peak will be 1.0
- i_tic_norm - This is the relative intensity of an MS1 peak within a spectrum, where the sum of all peaks within the spectrum will be 1.0
- mz - This is the mass to charge of the peak
- scan - this is the spectrum identifier that a specific peak belongs to. Multiples peaks (rows in the dataframe) belong to a single scan, and multiple scans (thousands to hundreds of thousands) are in each file
- rt - this is retenetion time of the peak
- polarity - 1 means positive, 2 means negative
MS2 Data Description
This file includes as each row all the MS2 peaks for the entire data file.
- i - This is the intensity of the peak
- i_norm - This is the relative intensity of an MS1 peak within its spectrum. The largest peak will be 1.0
- i_tic_norm - This is the relative intensity of an MS1 peak within a spectrum, where the sum of all peaks within the spectrum will be 1.0
- mz - This is the mass to charge of the peak
- scan - this is the spectrum identifier that a specific peak belongs to. Multiples peaks (rows in the dataframe) belong to a single scan, and multiple scans (thousands to hundreds of thousands) are in each file
- rt - this is retenetion time of the peak
- polarity - 1 means positive, 2 means negative
- precmz - this is the m/z of the precursor molecule that led to the fragmentation observed in the MS2
- ms1scan - this is the scan number of the precursor ms1 spectrum that directly preceeds the MS2 spectrum
- charge - this is the charge of the precursor molecule
base peak
The most intense ion, usually in MS/MS data is assigned an abundance of 100
Precursor ion/parent ion
Ions undergoing fragmentation.
Product ion/daughter ion
Ions resulting from parent/precursor ions.
Neutral loss
The Fragments that are lost as neutral molecules (not ionized and therefore not in the reported peaks). We can create a neutral loss spectrum. This is obtained from a mass spectrum by determining the mass differences between the precursor ion m/z and each of the other peaks in the spectrum and plotting the original intensity versus neutral mass.
Structural analog
A structural analog, also known as a chemical analog or simply an analog, is a compound having a structure similar to that of another compound, but differing from it with respect to a certain component.
Moiety
In organic chemistry, a moiety is a part of a molecule that is given a name because it is identified as a part of other molecules as well. For example, Benzyl acetate contains a benzyloxy moiety
Stereochemistry
3D chemistry. the study of stereochemistry focuses on the relationships between stereoisomers.
stereoisomers
compounds with the same molecular formula and sequence of bonded atoms (constitution), but differ in the geometric positioning of the atoms in space.
Metabolomics
the large-scale study of small molecules, commonly known as metabolites, within cells, biofluids, tissues or organisms. Collectively, these small molecules and their interactions within a biological system are known as the metabolome.
Proteomics
the study of the interactions, function, composition, and structures of proteins and their cellular activities
Peptide
A Molecule of between 2 and 50 amino acids. Less well-defined structure.
Protein
A molecule of 50 or more amino acids. Has a Well-defined structure that can adopt complex conformations known as secondary, tertiary, and quaternary structures.
de novo
a Latin term that means from the beginning
In silico
conducted or produced through computer modeling or computer simulation. An in silico experiment is one performed on a computer or via computer simulation.
Bottom-up proteomics or shotgun proteomics
a traditional method that digests/enzymatically dissolves large protein fragments into small peptides for analysis and subsequent separation of all of the resulting peptides by liquid chromatography.
Post-transitional modifications (PTM)
is the covalent process of changing proteins following protein biosynthesis. PTMs may involve enzymes or occur spontaneously.
Chromatography
taking a mixture and separating it - Every chromatography has two parts, stationary and mobile - The competition between the stationary and mobile and the amount of attraction of the mixture to each of them separates the mixture
Liquid chromatography
a column has a mobile phase and a stationary phase on the edges, based on how hydrophobic each part of the mixture is, they tend to stick more to the stationary phase or move with the mobile phase. This separates different parts of the mixture.
Liquid-chromatography tandem-mass spectrometry (LC-MS)
combining the physical separation of LC and the mass analysis capabilities of MS. This results in a 3d graph, one axis is the retention time, and one axis is the m/z. The third one is the intensity. - https://en.wikipedia.org/wiki/File:Liquid_chromatography_MS_spectrum_3D_analysis.png - Good fit for proteins and complex peptides - Used for broad sample coverage
Retention time
How long does it take for a compound in the mixture to get out of the chromatography tube.
Spectral Library
A set of curated reference spectra manually annotated by users to include chemical and structural information such as InChI, SMILES, Chemical Formula, Class, Subclass, and Superclass
Experimental MS/MS Spectra
Spectra that come directly from the mass spectrometer. May or may not have annotations.