Time Series Epenthesis: Clustering
Time Series Streams Requires Ignoring Some Data
Supporting
Material
- ICDM2011 paper
and presentation.
- Slide
to show all figures in higher resolution.
- Matlab source code to run all experiments is here.
Bird Calls
- An interwoven calls between Elf Owl (mp3)
and Pied-billed Grebe (mp3)
from AZFO Bird Sounds
Library.
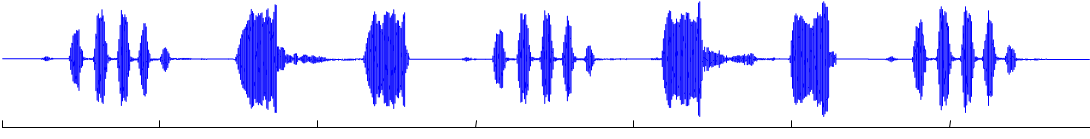
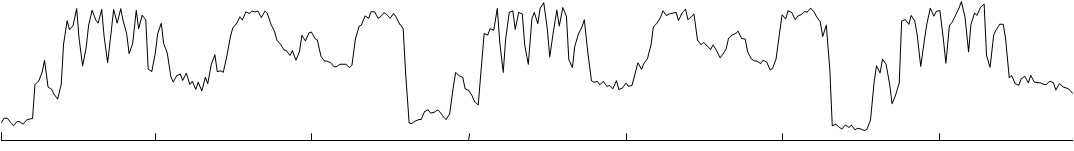
- The top time series shows an audio of the interwoven calls
we created.
- The
bottom time series shows the time series converted by applying
Mel-frequency
cepstrum (MFCC) technique.
- You can download MFCC time series here.
- Vdo shows the
clustering created from our algorithm is here.
- Matlab code for reproduction is here.
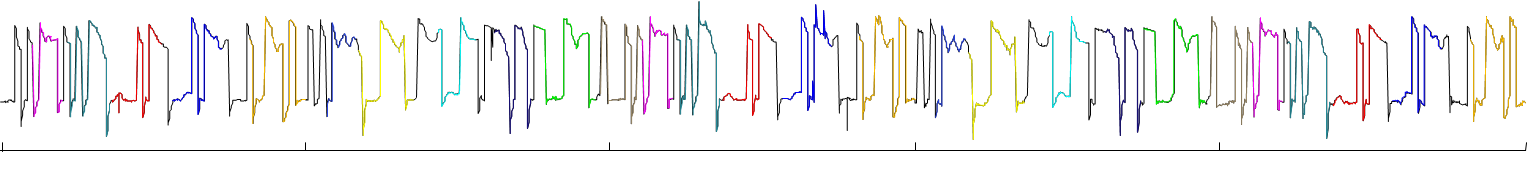
Poem "The Bells"
- A poem
"The
Bells"
by Edgar
Allan Poe.
- The
original audio file
(mp3)
is 4-minute long downloaded from LibriVox
collection of Internet
Archive.
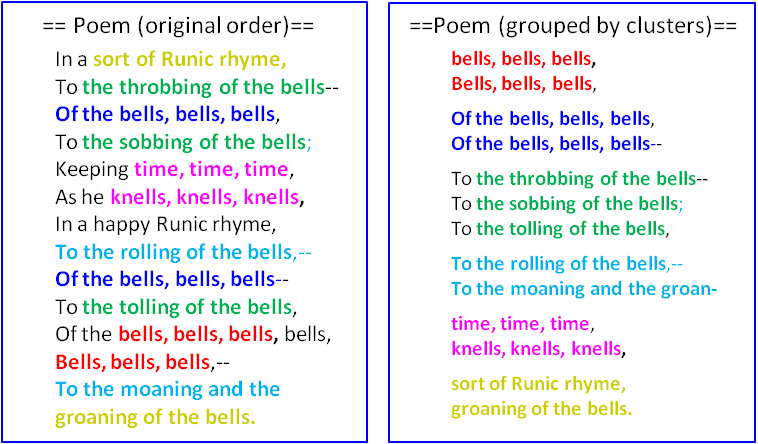
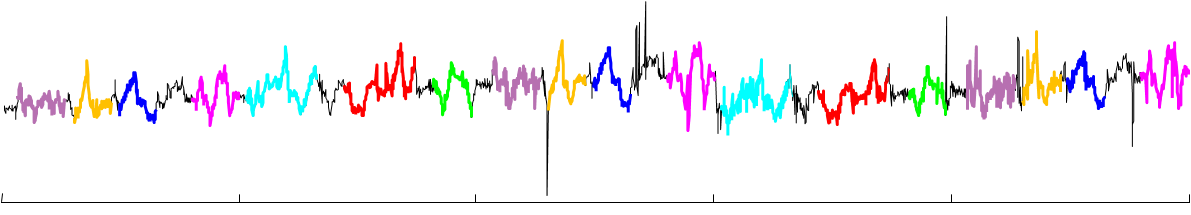
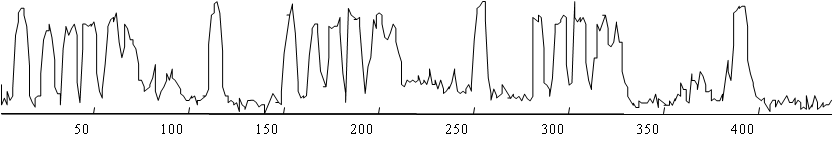
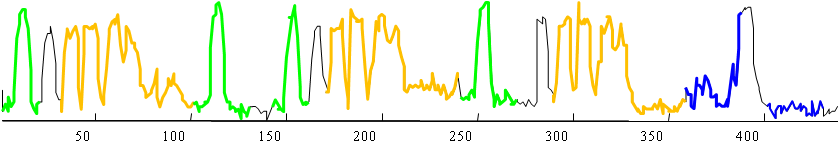
- We do
clustering on last
30-second excerpt shown in the left figure. The middle figure
shows that same
things, but text is grouped by clusters.
- You can see the result of clustering algorithm in this vdo.
- This is the code
for reproducing the experiment.
- Mirror: 30-sec poem in audio format (mp3), time
series transformed by MFCC technique (txt).
- Mirror: 4-min poem in audio format (mp3), time
series transformed by MFCC technique (txt). Note that the
introduction and ending parts are removed.
Winding Data
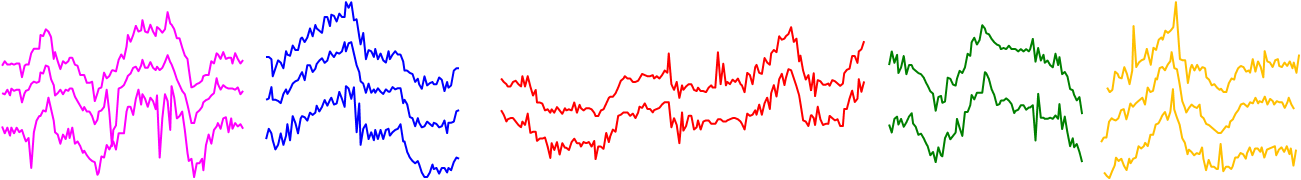
- Winding dataset contains seven dimensions. We provided a
mirror of the whole dataset here.
- The
top figure shows the time series in dimension U1 (the first dimension)
of the Winding dataset; subsequences in same color are in the same
cluster.
- The middle figure shows subsequences in five clusters from
seven clusters (total) of U1 dimension.
- The bottom figure shows the clustering results of the
Winding time series in the forth dimension.
- A vdo to show clustering result from our algorithm
on all seven dimensions is here.
- This is the code
for reproducing the experiment.
Electrocardiogram
1
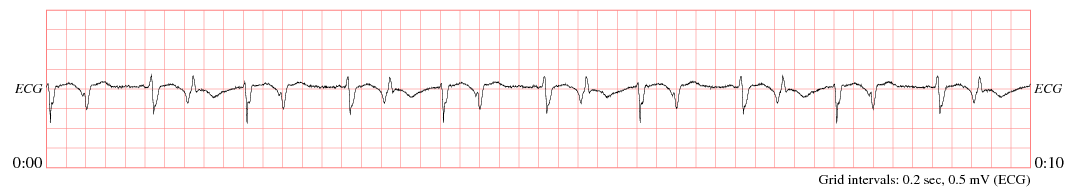
- A
heart beat time series from PhysioBank
ATM. (Dataset:
ANSI/AAAMI
EC13, Record: aami3c, Signals: ECG)
- The mirror of the data is provided here.
- Clustering result generated by our algorithm is here. Please
consider at step 7 and 8.
A
heart beat time series from PhysioBank
ATM. (Dataset:
ANSI/AAAMI
EC13, Record: aami3c, Signals: ECG, Length: 10 sec)
Electrocardiogram
2
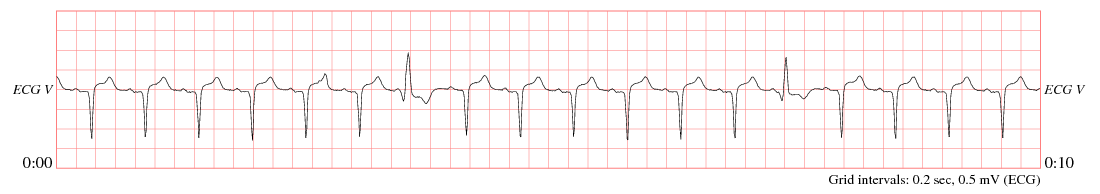
- A heart
beat time series from PhysioBank
ATM. (Dataset:
Challenge 2010
Training Set A, Record: a05, Signals: ECG V)
- We provided the mirror of the time series here.
- Clustering result generated by our algorithm is here. Please
consider at step 8 and 9.
Temperature Data
- The top time series shows the temperature of Jan 21st, 2006
(recorded
in the file dir.20060121_001_ceps.txt.
- Whole dataset contains temperatures of 56 days and 90 days
is here.
- The vdo to show clustering is here.
Contact Information:
rakthant
"at" cs
"dot" ucr
"dot" edu