CS130 Computer Graphics - Lab 8, Bezier Curves
Goals
Introduction
In this lab, you will render an approximation of a parametric curve known as the Bézier. In this lab, you are provided with a Point2D class that represents a coordinate on the screen.
Part 1: Rendering a Quadratic Bézier Curve
Consider the parametric equation for the straight line:
This is a Bézier curve with two control points and a degree of 1 (linear).
A quadratic Bézier curve has three control points and a degree of 2. This is a curve influenced by the control points P0, P1, and P2. Or another phrase, it is influence by vectors from P0 to P1 and P1 to P2. The parametric equation can be generated by recursively substituting the generalized parametric equation for the straight line:

to

Once simplified, you can substitute t values to locate the exact point on the Bézier curve. We will render lines using the DDA algorithm and incrementing by small dt from [0, 1].
Now, write a function that takes in three control points and renders the Bézier curve using line rendering. Provide a mouse event handler where three mouse clicks (in order) will generate the Bézier curve. Be aware that part 2 will be a modification of part 1 to render a Bézier curve with many control points.
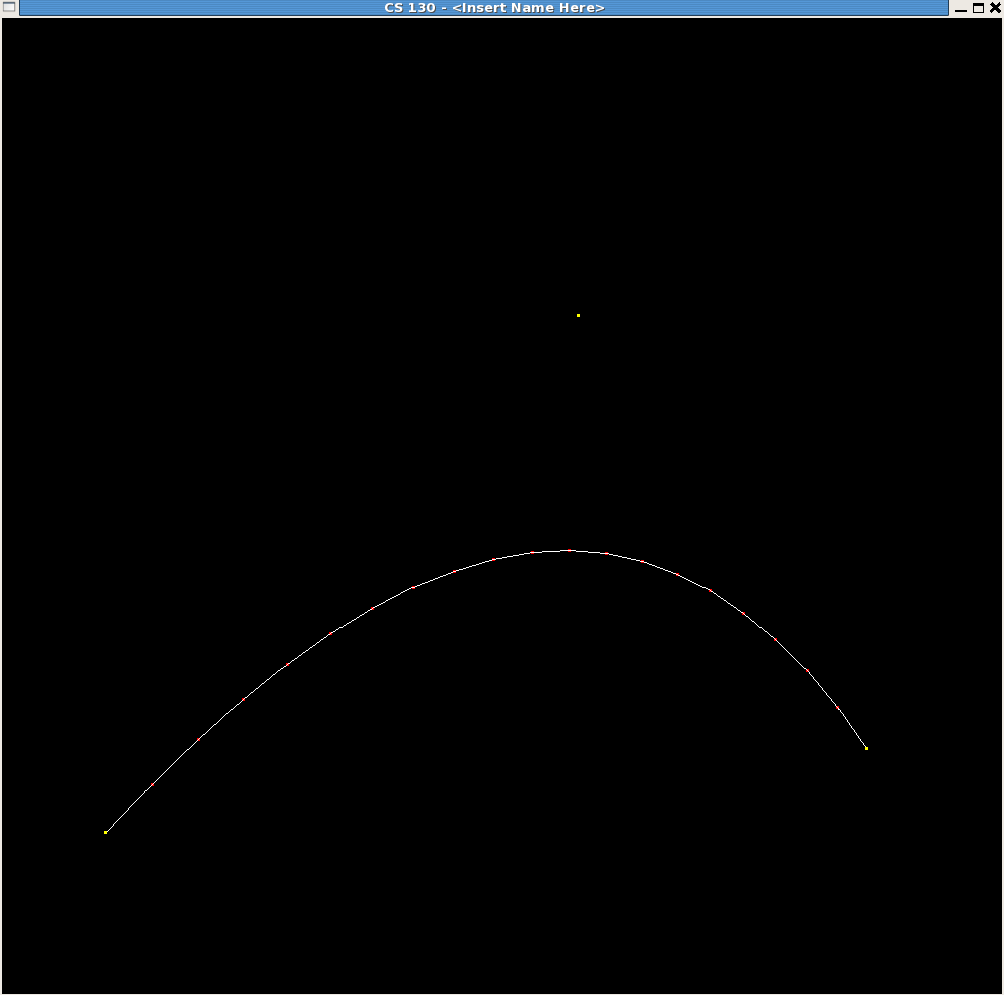
An example of a Bézier curve. is shown in the image below where the number of lines used to render the curve is 20.
Part 2: Generalization for Bézier Curves
Working through a formula for a cubic Bézier curve (degree n = 3), we can find that the coefficients for each term are binomial coefficients (1 3 3 1). Each control point, P, is given a specific weight. At a certain t, the weighted points Pi are aggregated into a single point on the Bézier curve. The generalization for a point on the Bézier curve for t from [0,1] is below:

Pay close attention here - the degree, n, is one less than the number of control points!
Modify your code such that your Bézier curve can take in a list of control points and the maximum number of line segments used to render the curve. Change your mouse handler function to continuously add mouse coordinates to a list so that your function can render them.
Hint: First write a function to calculate any specific point on curve B for any t, given all the control points (clicks) set so far.
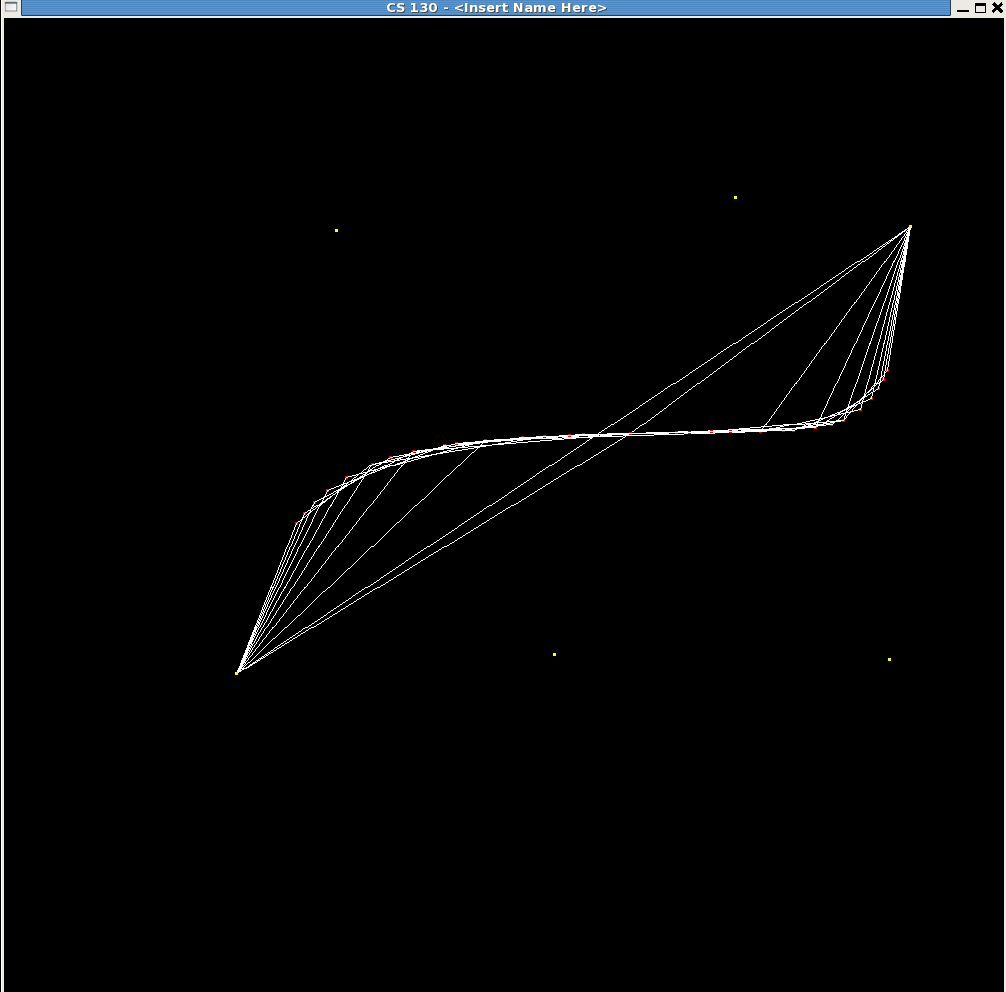
Show the TA that your Bézier curve can be rendered with more than 3 control points. An example of what multiple calls to your Bézier render function can do is shown below varying with the number of line segments and 6 control points:
Programming:
We begin with a single function registered to use mouse input. Such functions are registered using glutMouseFunc(void (*func)(int button, int state, int x, int y)) .
glutMouseFunc accepts a void function which takes in four arguments:
int button - when the function is executed, it will be passed in an argument telling whether it is a GLUT_LEFT_BUTTON, GLUT_RIGHT_BUTTON, or GLUT_MIDDLE_BUTTON event.
int state - when the function is executed, it will be passed in an argument telling whether it is a GLUT_DOWN or GLUT_UP event.
int x - the x pixel location of the mouse
int y - the y pixel location of the mouse
Note: the y mouse location is reversed where the axis, y = 0, is the top of the window. It may be helpful to invert this. If you are interested, take a look at gluUnProject, which is used to convert from window coordinates to screen coordinates.
In lab 1, we only registered a display callback with the function GL_render . This function would only be executed in the first iteration of glutMainLoop() . However, when we provide mouse input into our program, we generally want to redraw to the screen. This can be done by calling glutPostRedisplay() in the mouse event handler. glutPostRedisplay() sets the flag for the display event handler to execute again. You may research more on registering event handlers in the following link:
http://www.opengl.org/resources/libraries/glut/spec3/node45.html