In this lab, you will render an approximation of a parametric curve known as the Bézier. In this lab, you are provided with a Point2D class that represents a coordinate on the screen. Starter code is here.
Consider the parametric equation for the straight line:
This is a Bézier curve with two control points and a degree of 1 (linear). A quadratic Bézier curve has three control points and a degree of 2. This is a curve influenced by the control points P0, P1, and P2. Or another phrase, it is influence by vectors from P0 to P1 and P1 to P2. The parametric equation can be generated by recursively substituting the generalized parametric equation for the straight line:

to

Once simplified, you can substitute t values to locate the exact point on the Bézier curve. We will render lines using the DDA algorithm and incrementing by small dt from [0,1].
Now, write a function that takes in three control points and renders the Bézier curve using line rendering. Provide a mouse event handler where three mouse clicks (in order) will generate the Bézier curve. Be aware that part 2 will be a modification of part 1 to render a Bézier curve with many control points.
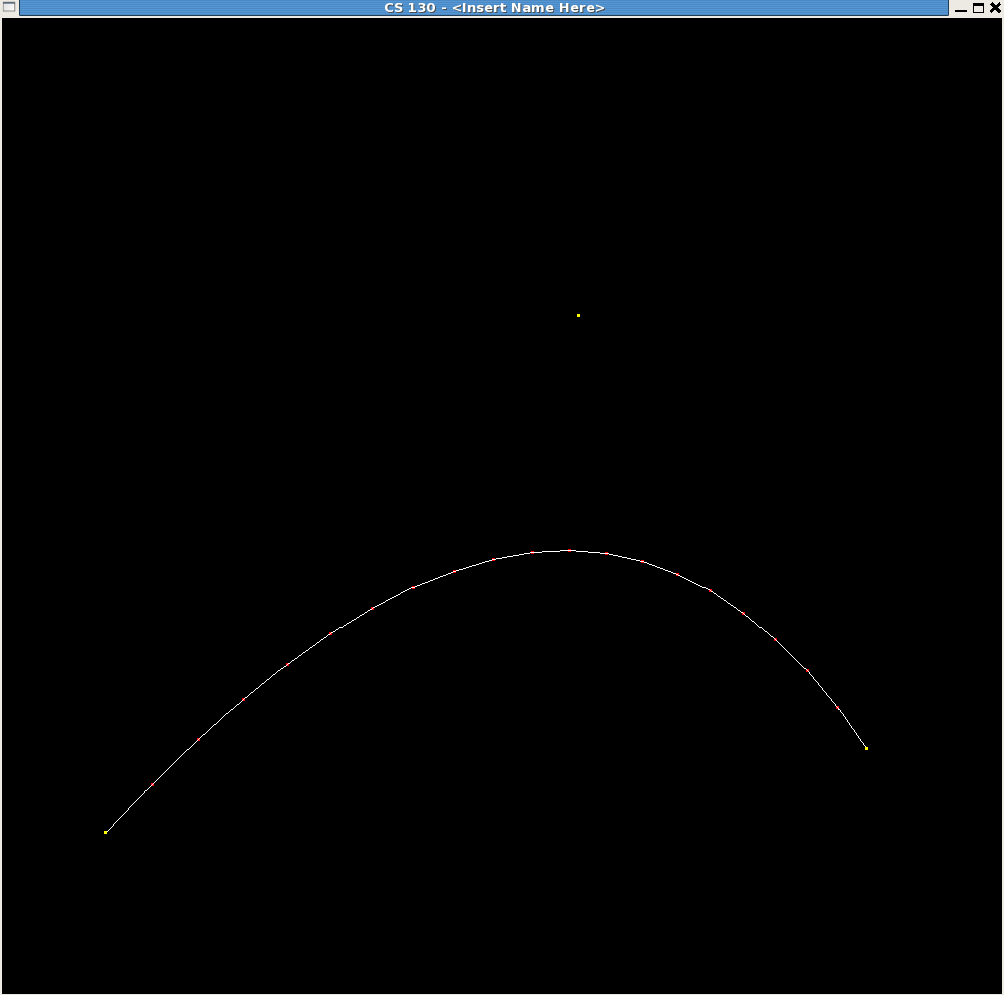
An example of a Bézier curve is shown in the image below where the number of lines used to render the curve is 20.
Working through a formula for a cubic Bézier curve (degree n = 3), we can find that the coefficients for each term are binomial coefficients (1 3 3 1). Each control point, P, is given a specific weight. At a certain t, the weighted points Pi are aggregated into a single point on the Bézier curve. The generalization for a point on the Bézier curve for t from [0,1] is below:

Pay close attention here - the degree, n, is one less than the number of control points!
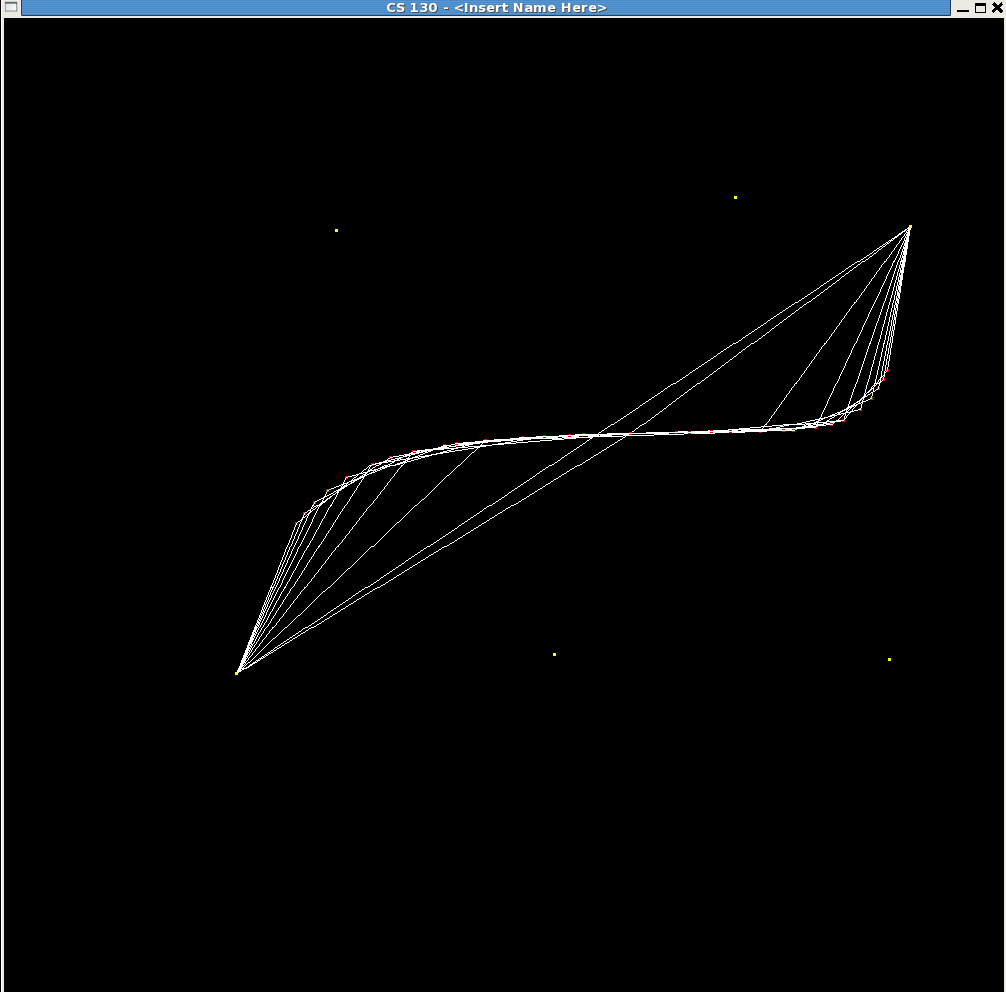
Modify your code such that your Bézier curve can take in a list of control points and the maximum number of line segments used to render the curve. Change your mouse handler function to continuously add mouse coordinates to a list so that your function can render them.
Hint: First write a function to calculate any specific point on curve B for any t, given all the control points (clicks) set so far.
Show the TA that your Bézier curve can be rendered with more than 3 control points. An example of what multiple calls to your Bézier render function can do is shown below varying with the number of line segments and 6 control points: