DEMO:
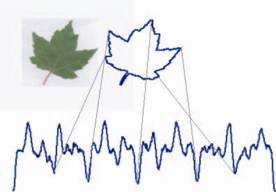
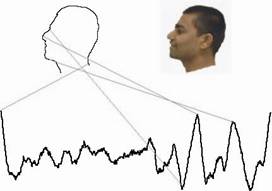
Converting an image profile into time series!
Sometimes, an image may be best
thought of as a time series to ease various data mining tasks. The figures below show the time series obtained
by converting a local (outer) angle at each and every point x of the image contour, starting from
the stem of the leaf or from the neck area of the head profile. The angle is formed by two straight lines
from point x-d to point x, and from point x to point x+d,
where d is the dth point forward and
backward from the current contour point (along the image contour). In the demo video, this angle is shown by the
lines in cyan/turquoise color on the contour (d =
40 for Face Profile, and d = 25 for
Leaf Profiles). Note that all the degree
values in the time series = raw angle – Pi, that is, if the two lines form a
straight line (180 degrees), the value of the time series will be 0. And finally, each time series is z-normalized
(mean = 0, standard deviation = 1).
|
|
|
Here’re
the THREE animations (AVI movie files) that can be downloaded (may need to save the files first).
For
related publications in time series data mining (classification, clustering,
Dynamic Time Warping (DTW), etc.), please visit my publications page.
For questions, comments or
suggestions, email me.
![]()
Main
Page About
Me Awards
Publications
Work/Activities/etc.
Teaching My Family CV